These data provide a comparison for the last 6 months of air pollutants, standardising measurements of ozone, carbon monoxide, sulphur dioxide, nitrogen dioxide and airborne particles into one easy-to-understand rating scale, the air quality category (AQC).
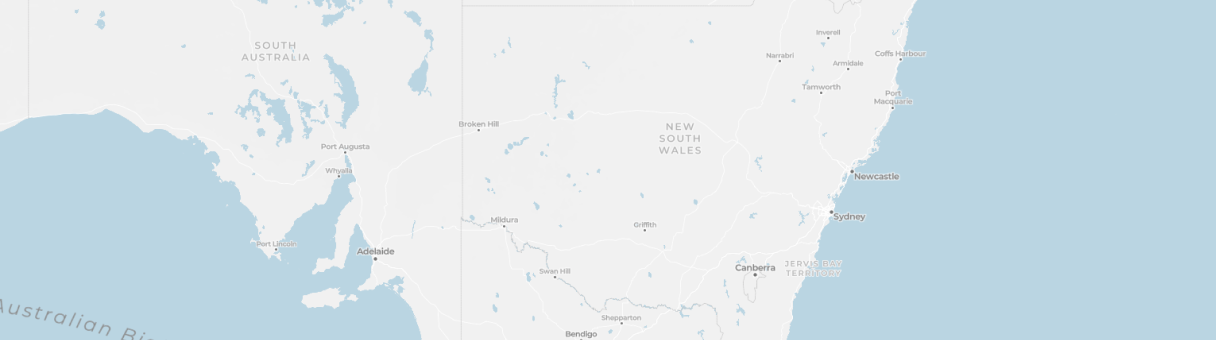
Use the interactive map for a spatial view of the air quality monitoring data.
Our health activity guide explains the AQC and provides associated health advice.
The daily air quality data table is updated every morning and summarises air quality concentration data for the previous day.
Notes:
- blue dots have no associated AQC
- N/A: monitored but data not available for the selected hour
- blank grey cell: not monitored at the station.
Retrieving data...
Interactive map
Launch the interactive map to view locations of all air quality monitoring stations across NSW.